10 Example 2: soar-gliding

Figure 10.1: Photograph by El Golli Mohamed, (c) creative commons
10.1 Classifying migratory flight in European bee-eaters: the dataset
European bee-eaters (Merops apiaster) have been tracked on the their migrations from Germany (to the Congo Basin) using SOI-GDL3pam loggers.
- Pressure is recorded every 15 minutes
- Light is recorded every 5 minutes
- Activity is recorded every 5 minutes
- Pitch is recorded every 5 minutes
- Temperature is recorded every 15 minutes
- Tri-axial acceleration is recorded every 4 hours
- Tri-axial magnetic field is recorded every 4 hours
10.2 Visualise data
Sensor images are a good place to start when analysing data, as they can give a rapid overview of the dataset. Darker colors represent lower values, and lighter colors (in this case yellow) represent higher values. Sensor images for activity (also known as an actogram), pitch, pressure and temperature are a good place to start. The following code plots this for us:
par(mfrow= c(1,4), # number of panels
    oma=c(0,2,0,6), # outer margin around all panels
    mar =  c(4,1,4,1)) # inner margin around individual fivure

plot_sensorimage(PAM_data$acceleration$date, ploty=FALSE,
          PAM_data$acceleration$act, main = "Activity",
          col=c("black",viridis::cividis(90)), cex=1.2, cex.main = 2)

plot_sensorimage(PAM_data$acceleration$date, plotx=TRUE, ploty=FALSE, labely=FALSE,
          PAM_data$acceleration$pit,  main="Pitch",
          col=c("black",viridis::cividis(90)), cex=1.2, cex.main = 2)

plot_sensorimage(PAM_data$pressure$date, plotx=TRUE, ploty=FALSE, labely=FALSE,
          PAM_data$pressure$obs,  main="Pressure",
          col=c("black",viridis::cividis(90)), cex=1.2, cex.main = 2)

plot_sensorimage(PAM_data$temperature$date, labely=FALSE,
          PAM_data$temperature$obs,  main="Temperature",
          col=c("black",viridis::cividis(90)), cex=1.2, cex.main = 2)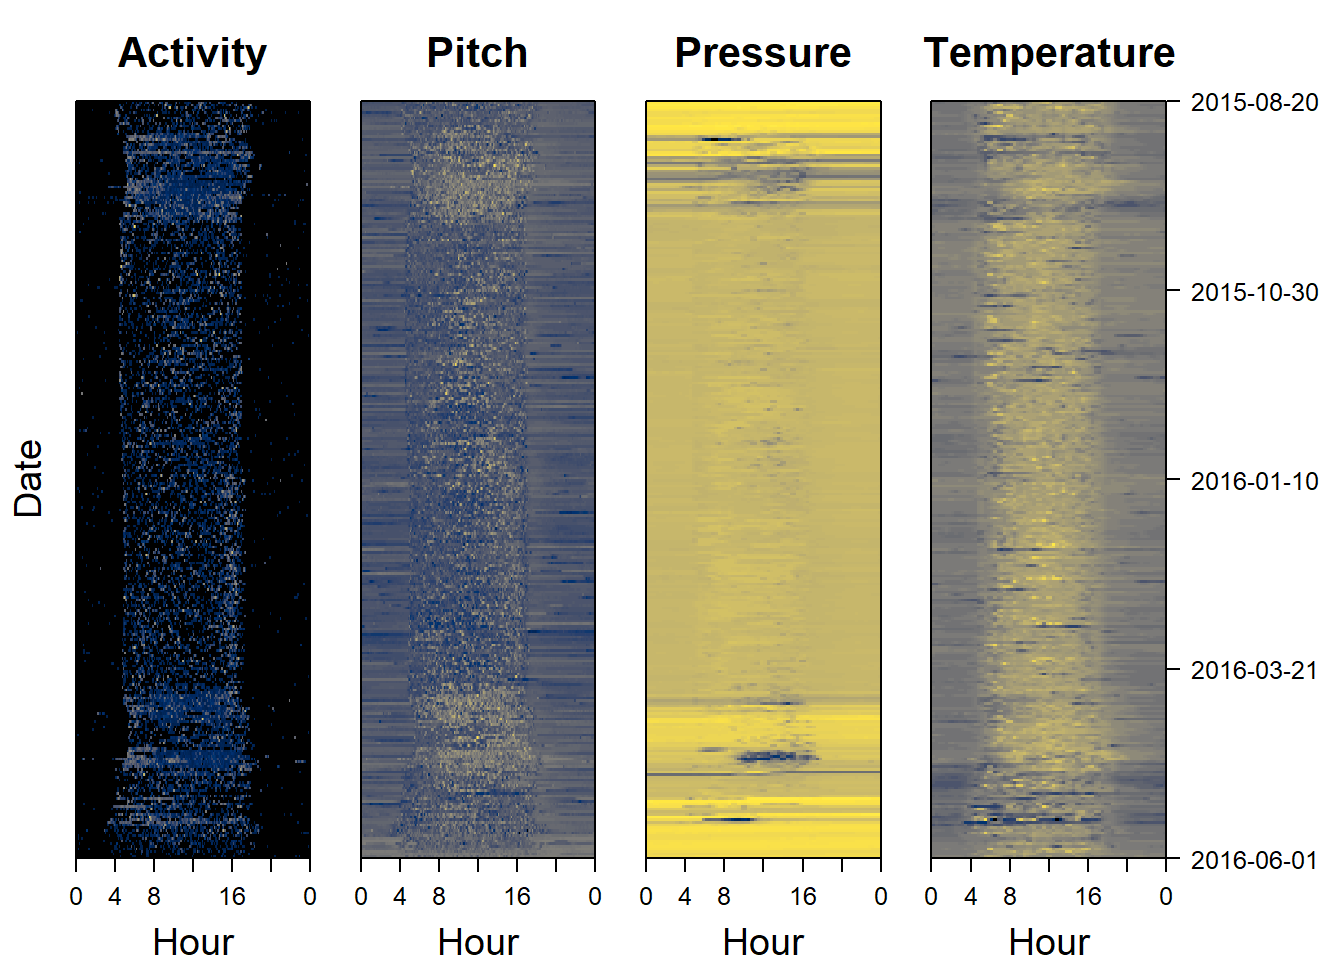
10.3 What should we look for?
Compared to the hoopoe, the activity patterns are less clear. However, there are some patterns become apparent.
- The bird is visibly never active at night - It only migrates during the day.
- During migration (August and April) the overall pressure changes from one night to the next (horizontal bars of different colors). Indeed pressure varies geographically and altitudinally - suggesting that those nights the bird is somewhere different.
- During this migration period, pressure drops substatially as does temperature - indicating higher altitude flights than ususal
- During the migration period, activity is low but sustained
- During the migration period, pitch is constant
## Warning: package 'dygraphs' was built under R version 4.4.3Some, if not all of these can therefore be used to identify migratory flight in European bee-eaters. We could for instance use create_summary_statistics(..., method="endurance") or create_summary_statistics(..., method="pressure") based on these data patterns. However, because these species soar-glide and are therefore in sunlight while thermalling (as opposed to hidden under leaves), periods of constant sunshine could also be used to identify migratory soar-gliding usingcreate_summary_statistics(..., method="light").
10.4 What variables make the most sense for classifying?
We start with endurance flights. These can be extracted from the data using the following code.
# get twilights (general geolocator method)
twl = twilightCalc(PAM_data$light$date, PAM_data$light$obs,
                             LightThreshold = 2,
                             ask = FALSE)

TOclassify = create_summary_statistics(dta = PAM_data,
                     method= "endurance",
                     light_thld = 2,
                     twl = twl,
                     interp = TRUE)

# To look at the data use the following line.
# Here it is commented out to avoid a messy document
# head(TOclassify)
We can then plot the data. Here, to save space, we plot the variables which on first glance seem to best distinguish migration from non-migration. These include:
- Long periods spend always activity: duration
- Active day where the bird changed pressure (i.e. altitude) a lot: total_daily_P_change
- Active periods where the pressure changed from one night to the next: night_P_diff
- Active periods where there were the bird’s body wasin a specific position: median_pitch
par(mfrow= c(4,1), # number of panels
    oma=c(0,0,0,0), # outer margin around all panels
    mar =  c(1,4,1,1)) # inner margin around individual fivure

plot(TOclassify$date, TOclassify$duration, type = "l",
            ylab = "Event duration", xlab="")

plot(TOclassify$date, TOclassify$total_daily_P_change, type = "l",
            ylab = "Cumul daily P chng", xlab="")

plot(TOclassify$date, TOclassify$night_P_diff, type = "l",
            ylab = "Pressure diff btwn nights", xlab="")

plot(TOclassify$date, TOclassify$median_pitch, type = "l",
            ylab = "Pitch", xlab="")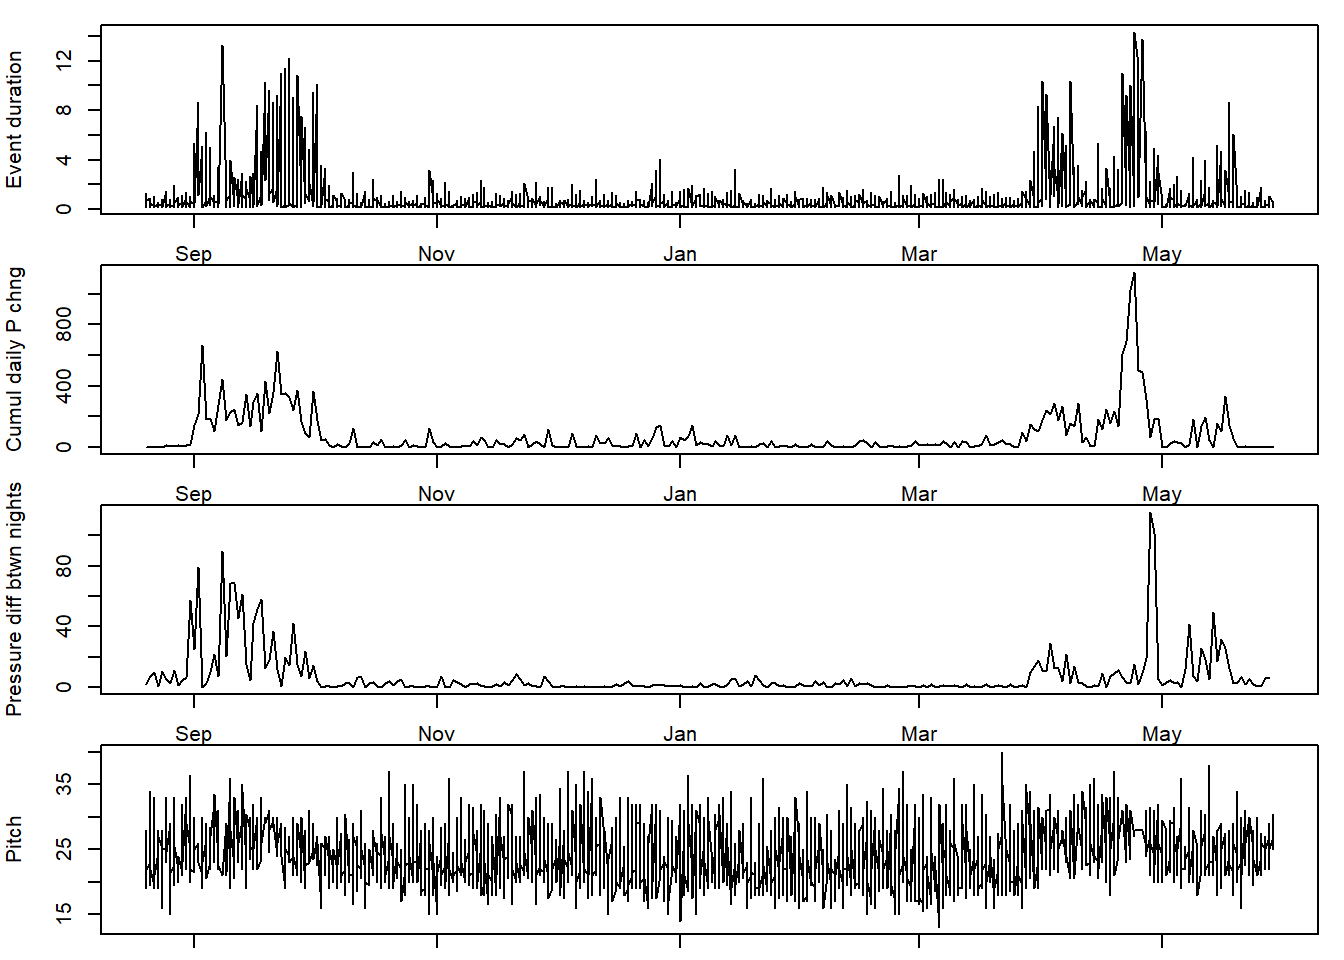
10.5 Classify using HMM
There are two options for performing the classification of the data. One is to include multiple variables as is (see predictor 1 below). The other is to combine them into one metric (see predictor 2 below). The “hmm” method in classify_summary_statistics relies on the package depmixS4, and by default classify_summary_statistics treats each variable (i.e. a data column) with the formula variable ~ 1 with family = gaussian(). Family can easily be changed, however for a more complicated model, it is recommended to implement directly using the depmixS4 package.
Beware - some methods do not allow any NAs in the dataset
# Get rid of any extra NAs
TOclassify = TOclassify[complete.cases(TOclassify),]


# Select the columns to use as predictors in the model
predictor = TOclassify[, c("duration",
                            "night_P_diff",
                            "median_pitch",
                            "total_daily_P_change")]


# Perform the classification
classification = classify_summary_statistics(predictor,
                             states=2,
                             method = "hmm")
## converged at iteration 15 with logLik: -8216.3## Warning in .local(object, ...): Argument 'type' not specified and will default
## to 'viterbi'. This default may change in future releases of depmixS4. Please
## see ?posterior for alternative options.10.5.1 Translate the classification events into something usable
The classification results in a series of numbers which can be accessed under classification$cluster. These indicate the states of the individual during a given event, in this case “migrating” and “not migrating”. However, we still need to figure out which number corresponds to which state, because these can be allocated randomly by the classification algorithm.
First, we start by taking the classification, and adding the data from the flight events to the same resolution of the data that we want to plot, using create_merged_classification(). For example, we use pressure, as this displays soar-gliding behaviour quite well.
# Convert the events to data
pressure_classification = create_merged_classification(from = TOclassify$start,
                                             to = TOclassify$end,
                                             classification = classification$cluster,
                                             add_to = PAM_data$pressure)

pressure_classification = data.frame(cluster=pressure_classification)
To do so, we find the sate with the largest pressure difference, because it will indicate the state where the bird was changing altitude the most and therefore soar-gliding, which will be most obvious during migration.
# Find the pressure difference for each state
P_state1 = median(TOclassify$total_daily_P_change[classification$cluster == 1])
P_state2 = median(TOclassify$total_daily_P_change[classification$cluster == 2])
P_states = c(P_state1, P_state2)

# Allocate the state with the highest pressure difference to migration
Mig_state = which(P_states == max(P_states))

# Now add this information to the classification
pressure_classification$states = pressure_classification$cluster
pressure_classification$states[pressure_classification$cluster == Mig_state] = "Migration"
pressure_classification$states[pressure_classification$cluster != Mig_state] = "Active"
pressure_classification$states[is.na(pressure_classification$cluster)] = "Unclassified"

# Associate each state with a color
pressure_classification$colour = pressure_classification$cluster
pressure_classification$colour[pressure_classification$cluster == Mig_state] = "orange"
pressure_classification$colour[pressure_classification$cluster != Mig_state] = "royalblue3"
pressure_classification$colour[is.na(pressure_classification$cluster)] = "black"
10.5.2 Plot the classification
Here we only plot sowthward migration, to help visualise the classification results.
par(mar=c(3,3,1,1))
# PLOT ALL THE DATA
# plot the pressure data
plot(PAM_data$pressure$date, PAM_data$pressure$obs,
type="l",
ylab="Pressure (hPa)",
xlab="Date")
# Add the classification to the plot
points(PAM_data$pressure$date, PAM_data$pressure$obs,
col=pressure_classification$colour,
pch=16,
cex=0.8)
# Add a legend to see which color matches which classification
legend( PAM_data$pressure$date[length(PAM_data$pressure$date)/2],800 ,
c("Unclassified", "Active", "Migrating" ) ,
col = c("black", "royalblue3","orange"),
pch=16)
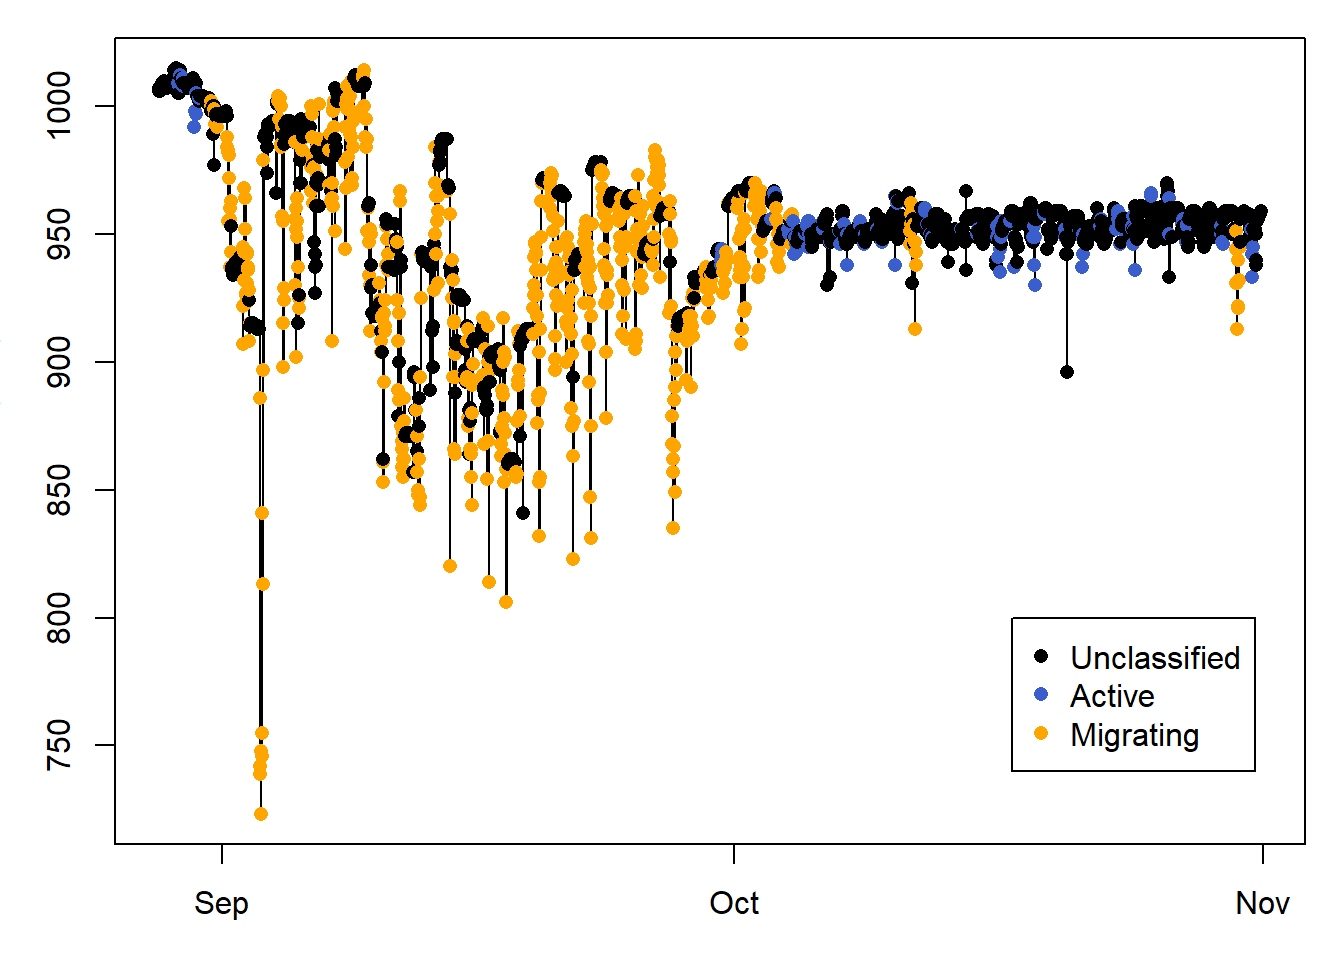
# PLOT A SUBSET OF THE DATA
id = 400:3500
# plot the pressure data
plot(PAM_data$pressure$date[id], PAM_data$pressure$obs[id],
type="l",
ylab="Pressure (hPa)",
xlab="Date")
# Add the classification to the plot
points(PAM_data$pressure$date[id], PAM_data$pressure$obs[id],
col=pressure_classification$colour[id],
pch=16)
# Add a legend to see which color matches which classification
legend( PAM_data$pressure$date[id[length(id)-700]],800 ,
c("Unclassified", "Active", "Migrating" ) ,
col = c("black", "royalblue3","orange"),
pch=16)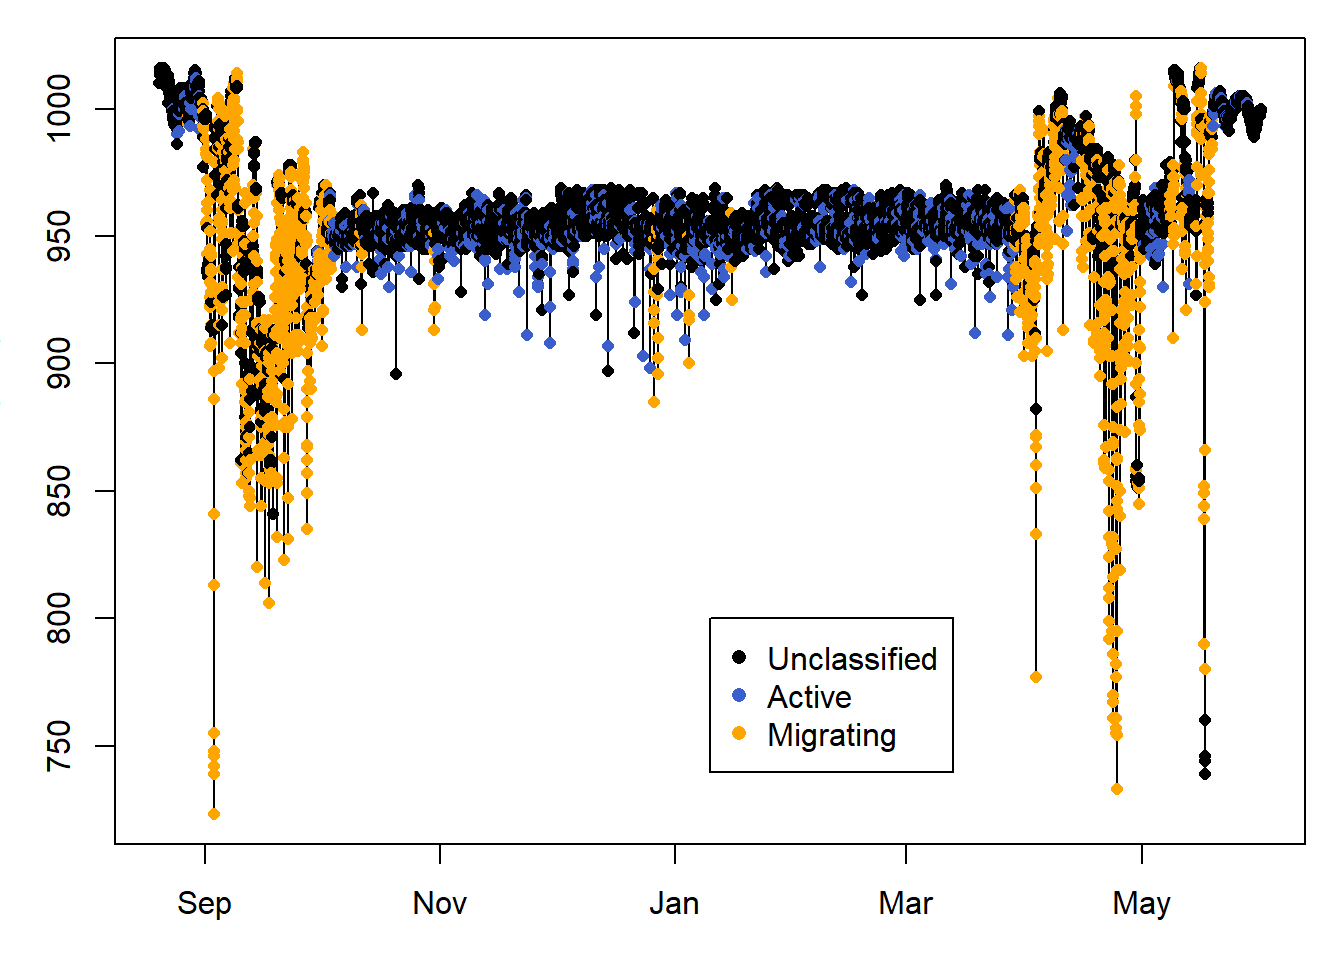
10.6 Classify using pressure
Note from the previous classification where the pressure is very low, and therefore at very high altitudes, yet it was not active. This is because bee-eaters soar glide, and using this strategy, they flap their wings very little. Another way of classifying flight events, is to use a change in pressure greater than what we would expect from weather. In this case, pressure data are collected every 30 minutes, and we wouldn’t expect a pressure change greater than 2hPa/30 minutes when the bird is on the ground (you can for instance use nightime when birds do not fly to determine what this threshold should be). Thus we set Pdiff_thld = 2.
# twl = twilightCalc(PAM_data$light$date, PAM_data$light$obs,
#                              LightThreshold = 2,
#                              ask = FALSE)

TOclassify = create_summary_statistics(dta = PAM_data,
                     method= "pressure",
                     Pdiff_thld = 2,
                     light_thld = 2,
                     twl = twl,
                     interp = TRUE)

# Get rid of any extra NAs
TOclassify = TOclassify[complete.cases(TOclassify),]


# Select the columns to use as predictors in the model
predictor = TOclassify[, c("duration",
                            "night_P_diff",
                            "median_pitch",
                            "total_daily_P_change")]


# Perform the classification
classification = classify_summary_statistics(predictor,
                             states=2,
                             method = "hmm")
## converged at iteration 13 with logLik: -7954.512## Warning in .local(object, ...): Argument 'type' not specified and will default
## to 'viterbi'. This default may change in future releases of depmixS4. Please
## see ?posterior for alternative options.10.6.1 Translate the classification events into something usable
# Convert the events to data
pressure_classification = create_merged_classification(from = TOclassify$start,
to = TOclassify$end,
classification = classification$cluster,
add_to = PAM_data$pressure)
pressure_classification = data.frame(cluster=pressure_classification)
# Find the pressure difference for each state
P_state1 = median(TOclassify$total_daily_P_change[classification$cluster == 1])
P_state2 = median(TOclassify$total_daily_P_change[classification$cluster == 2])
P_states = c(P_state1, P_state2)
# Allocate the state with the highest pressure difference to migration
Mig_state = which(P_states == max(P_states))
# Now add this information to the classification
pressure_classification$states = pressure_classification$cluster
pressure_classification$states[pressure_classification$cluster == Mig_state] = "Migration"
pressure_classification$states[pressure_classification$cluster != Mig_state] = "Active"
pressure_classification$states[is.na(pressure_classification$cluster)] = "Unclassified"
# Associate each state with a color
pressure_classification$colour = pressure_classification$cluster
pressure_classification$colour[pressure_classification$cluster == Mig_state] = "orange"
pressure_classification$colour[pressure_classification$cluster != Mig_state] = "royalblue3"
pressure_classification$colour[is.na(pressure_classification$cluster)] = "black"
# Store for later
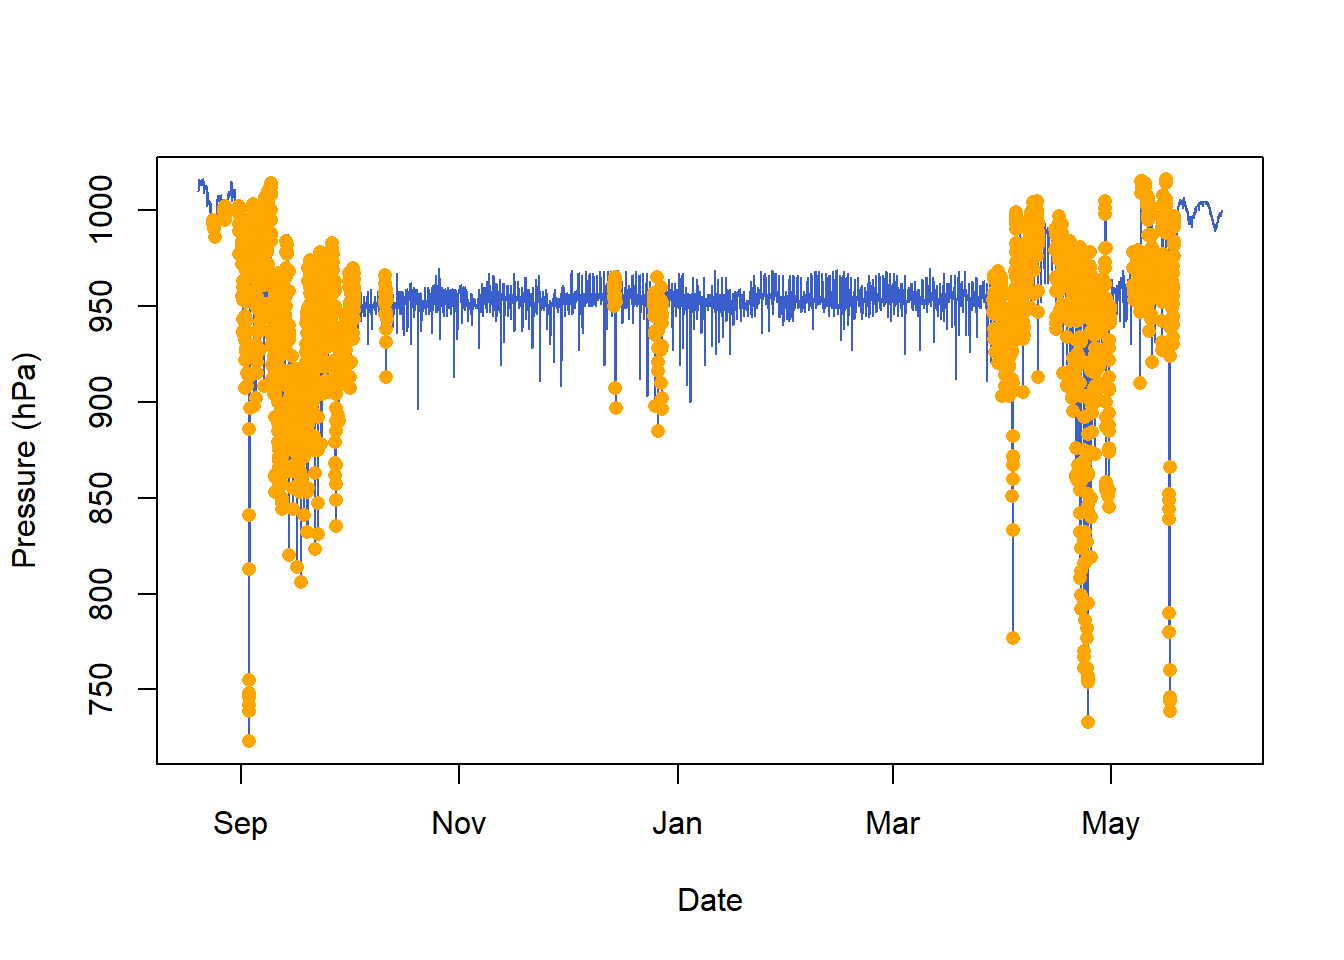
endurance_classification = pressure_classification10.6.2 Plot the classification
Here we only plot sowthward migration, to help visualise the classification results.
par(mar=c(3,3,1,1))
# PLOT ALL THE DATA
# plot the pressure data
plot(PAM_data$pressure$date, PAM_data$pressure$obs,
type="l",
ylab="Pressure (hPa)",
xlab="Date")
# Add the classification to the plot
points(PAM_data$pressure$date, PAM_data$pressure$obs,
col=pressure_classification$colour,
pch=16,
cex=0.8)
# Add a legend to see which color matches which classification
legend( PAM_data$pressure$date[length(PAM_data$pressure$date)/2],800 ,
c("Unclassified", "Active", "Migrating" ) ,
col = c("black", "royalblue3","orange"),
pch=16)
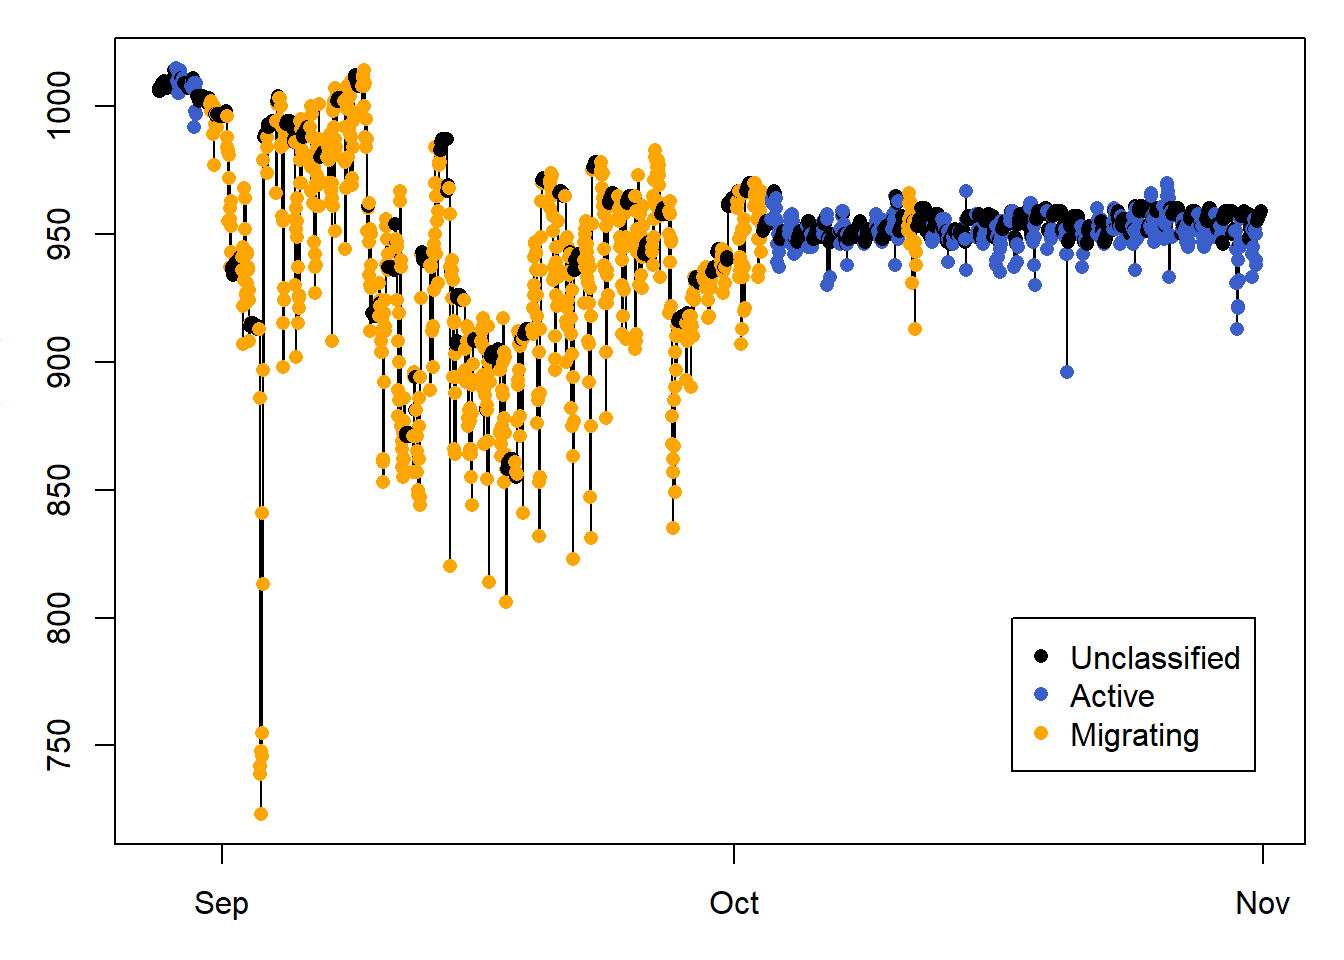
# PLOT A SUBSET OF THE DATA
id = 400:3500
# plot the pressure data
plot(PAM_data$pressure$date[id], PAM_data$pressure$obs[id],
type="l",
ylab="Pressure (hPa)",
xlab="Date")
# Add the classification to the plot
points(PAM_data$pressure$date[id], PAM_data$pressure$obs[id],
col=pressure_classification$colour[id],
pch=16)
# Add a legend to see which color matches which classification
legend( PAM_data$pressure$date[id[length(id)-700]],800 ,
c("Unclassified", "Active", "Migrating" ) ,
col = c("black", "royalblue3","orange"),
pch=16)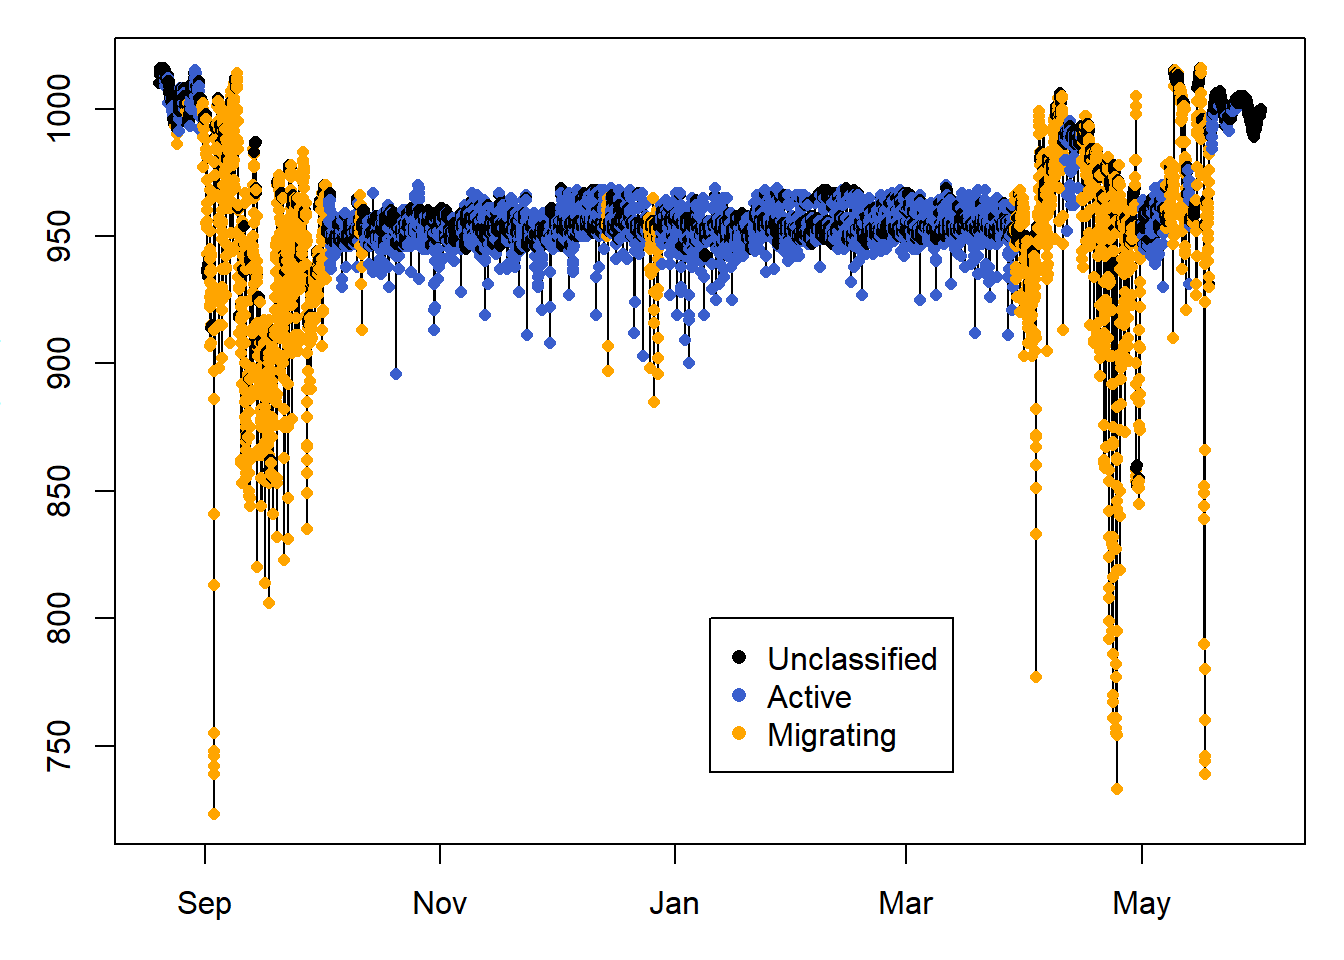
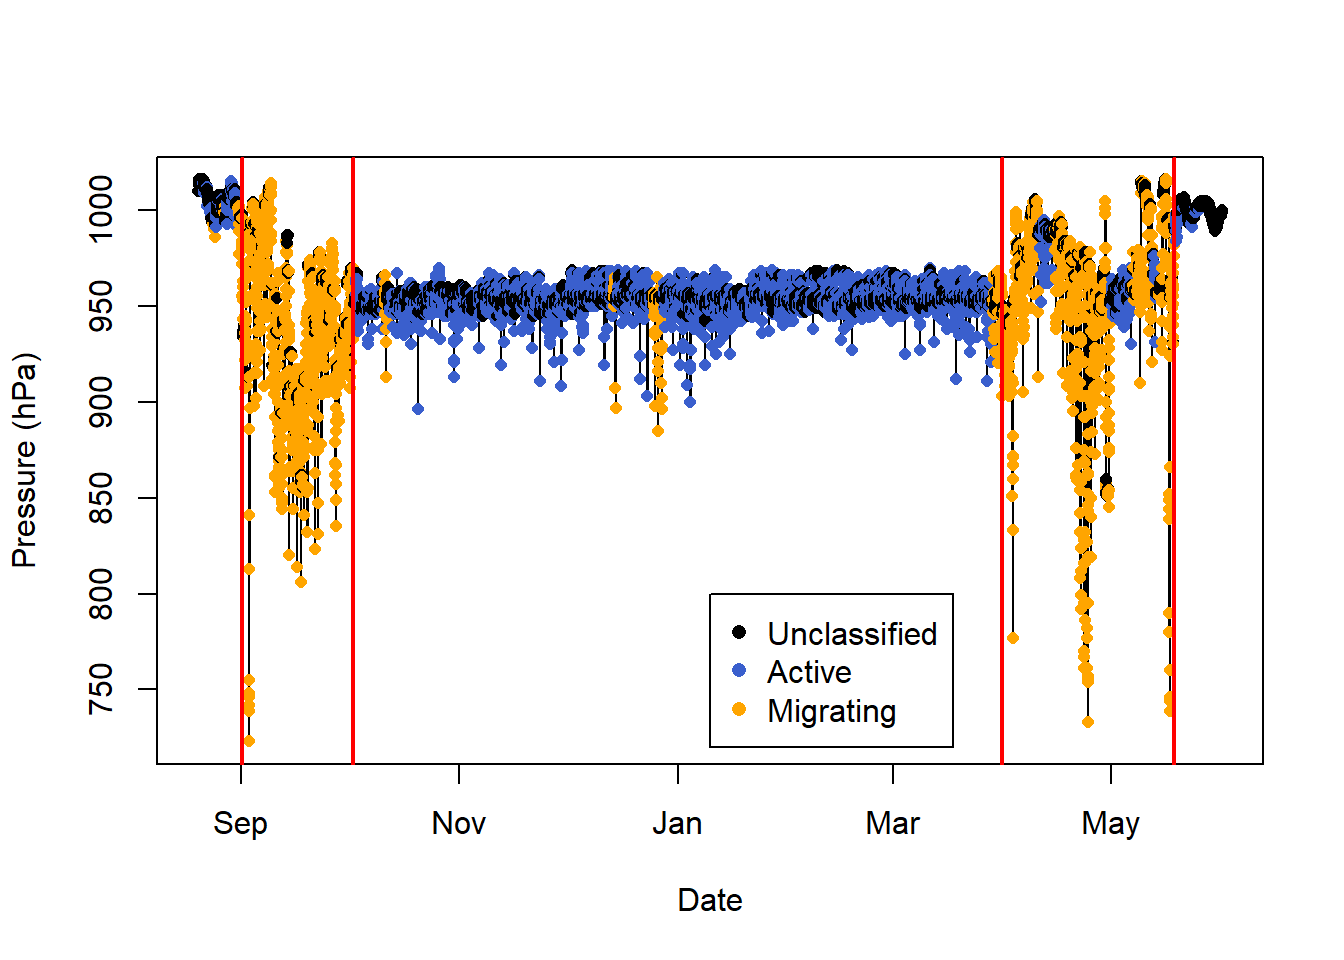
10.7 Classify using a changepoint analysis
The changepoint analysis looks for changes in the mean and/or variance in the data, and can be implemented in pamlr using classify_changepoint. We can perform this and compare with the previous classification seen above. It seems like classify_changepoint overclassifies migration within the migratory period, which classify_summary_statistics overclassifies migration during the non-breeding season in Africa.
changepoints = classify_changepoint(PAM_data$pressure$obs)

# plot the timeseries
plot(PAM_data$pressure$date, PAM_data$pressure$obs,
     type="l",
     ylab="Pressure (hPa)",
     xlab="Date")

# Add the classification to the plot
points(PAM_data$pressure$date, PAM_data$pressure$obs,
       col=pressure_classification$colour,
       pch=16,
       cex=0.8)

# Add a legend to see which color matches which classification
legend( PAM_data$pressure$date[length(PAM_data$pressure$date)/2],800 ,
        c("Unclassified", "Active", "Migrating" ) ,
        col = c("black", "royalblue3","orange"),
        pch=16)

# Add the changepoints
abline(v=PAM_data$pressure$date[changepoints$changepoints],
       col="red",
       lwd=2)